
Apple Math Activity: Apple Taste Test and Class Graph with Bar Graphs - Shop GYTO - Get Your Teach On

Apple Math Activity: Apple Taste Test and Class Graph with Bar Graphs

$1.50

Want unlmited access to this resource? SUBSCRIBE NOW for instant access to download this and all of our resources!

Resource Type:

  • Activities

Number of Pages:

  • 9

Applicable Grade Level(s):

  • 1st Grade
  • 2nd Grade
  • 3rd Grade

Subject(s):

  • Math: Graphing

Included File Type(s):

  • PDF

Common Core Standards:

TEKS (if available):

Seasonality (if applicable):

  • Fall

Taste & Graph Our Favorite Apples | Apple Taste Test & Graphing Activity

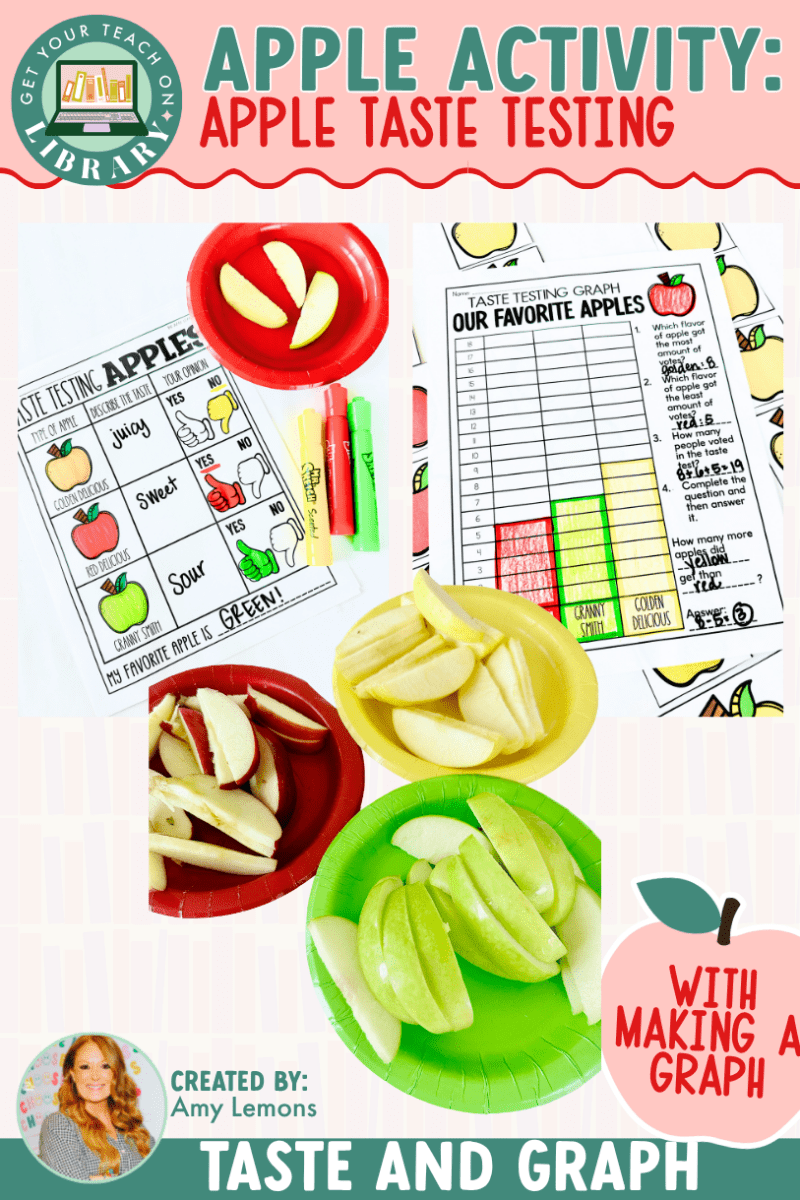
Bring math to life with a fun and delicious Apple Taste Test & Graphing Activity! Students taste three different varieties of apples, describe each one, choose their favorite, and then work together to create a class graph of the results.

This hands-on activity combines graphing, data collection, comparing numbers, and descriptive language for an engaging fall learning experience.

How It Works

Prepare samples of Red Delicious, Golden Delicious, and Granny Smith apples for students to taste. As students try each variety, they complete the included taste-testing page by describing the flavor and deciding whether or not they like it.

After tasting all three apples, each student chooses a favorite. Use the included apple pieces and graph headers to create a whole-class graph showing the results.

Students can then use the completed graph to answer questions and compare the class data.

Skills Practiced

  • Collecting and organizing data
  • Creating a graph
  • Reading and interpreting graphs
  • Comparing quantities
  • Identifying most and least
  • Finding how many more
  • Describing and comparing tastes
  • Making and recording choices

What’s Included

  • Apple taste-testing recording sheet
  • Class graph headers
  • Red Delicious apple graph pieces
  • Granny Smith apple graph pieces
  • Golden Delicious apple graph pieces
  • Black-and-white apples for students to color
  • Black-and-white graph headers
  • Student graphing and data analysis page
  • Follow-up questions for interpreting the graph

Perfect for Fall Learning

This activity is perfect for an apple unit, fall math lesson, back-to-school graphing activity, math center, science connection, or whole-group data lesson. It gives students a real-world reason to collect and analyze data while making learning memorable and fun.

Just grab three varieties of apples, print the included materials, and you're ready for an engaging apple taste test and graphing lesson!

Recently viewed

All downloads are licensed for personal use only or in your classroom. Downloads may be printed or used once. Customers looking to print multiple copies must purchase multiple licenses. These downloads may not be sold or used in any products made for sale, such as Teachers Pay Teachers products.